Short answer: Volume profile shows you where a market actually traded the most, and one trader, LamboRaul, uses it to call trend days and fade the first move. The core read: when price opens inside the prior session's value area, expect a trending day, then look to fade the first push into a key level when it sweeps liquidity.
This is a walk-through of that strategy, the volume profile concepts behind it, and the one thing people get wrong when they try to turn it into a direction call.
Volume profile in plain terms
Most charts show price over time. Volume profile rotates that and shows volume over price: at which prices did the most contracts actually change hands. Three levels do the work:
- POC (point of control): the single price with the most volume traded. The fair-value magnet for the session.
- VAH and VAL (value area high and low): the top and bottom of the band holding roughly 70% of the session's volume.
- The value area: everything between the VAH and the VAL. This is where the market spent most of its time and found the most acceptance.
LamboRaul builds these from the prior regular-hours cash session, marked as a fixed range so the levels stay put. His reasoning: a lot of institutions cannot trade outside regular hours, so the cash-session profile carries the most weight for the next day's decisions.
The strategy: open location, then the value fade
The setup runs in two reads.
Read one: where did price open relative to prior value? His backtested claim, stated twice in the video and based on five years of data, is simple. When price opens inside the prior value area, you get a higher probability of a trend day. More price discovery, less sideways chop.
Read two: fade the first move into a level. Once price is inside value, he waits for the first move of the day to push into one of the key levels (the POC, the VAL, or the VAH), expects a liquidity sweep at that level, and fades it. The sweep is the trigger, and order flow (aggressive buying and selling, and whether it gets absorbed) is the confirmation.
In the video, price pulled down into the prior POC at 29,430 on NQ. Sellers got absorbed, buyers stepped in, and he went long. He faded a move down by buying it, then scalped it for a few R.
The setup at a glance
| Step | What he looks for |
|---|---|
| 1. Mark prior value | Fixed-range volume profile on the prior cash session: POC, VAH, VAL |
| 2. Check the open | Price opening inside value raises the odds of a trend day |
| 3. Wait for the first push | Into the POC, VAL, or VAH, not a random level |
| 4. Expect a sweep | A liquidity grab through the level, not clean acceptance |
| 5. Fade it | Enter against the sweep, confirm with order flow, target the next level |
The nuance people get wrong
Here is the trap. Open location tells you the day will probably move. It does not tell you which way.
There is no "price is between the POC and the VAL, so it drops" rule in this strategy. Position inside the value area does not encode direction. Opening in the lower half of value is not automatically bearish, and opening in the upper half is not automatically bullish. The model predicts a trend day and then trades the fade of the first sweep, wherever that sweep happens.
So a clean break through the VAL that keeps running lower is not the base case here. In this framework that is the fade failing. It can absolutely happen, and that is where a trend leg comes from, but it triggers on acceptance below the level, meaning price builds new value there rather than sweeping and snapping back.
One more caveat worth keeping. This edge was measured on NQ, the Nasdaq future, on a five-minute chart, using the cash-session profile and the CME order book. On spot forex the picture changes. Forex runs 24 hours with no closing auction, no single order book, and the volume on your chart is tick volume, not real traded size. The concept travels. The exact probabilities and the order-flow trigger do not transplant cleanly from futures to spot.
A worked example on EUR/USD
Here is the setup on a real chart. EUR/USD coiled inside the prior NY-session value area, sitting in the lower portion between the POC and the VAL, with the broader bias bearish on both fundamentals and technicals.
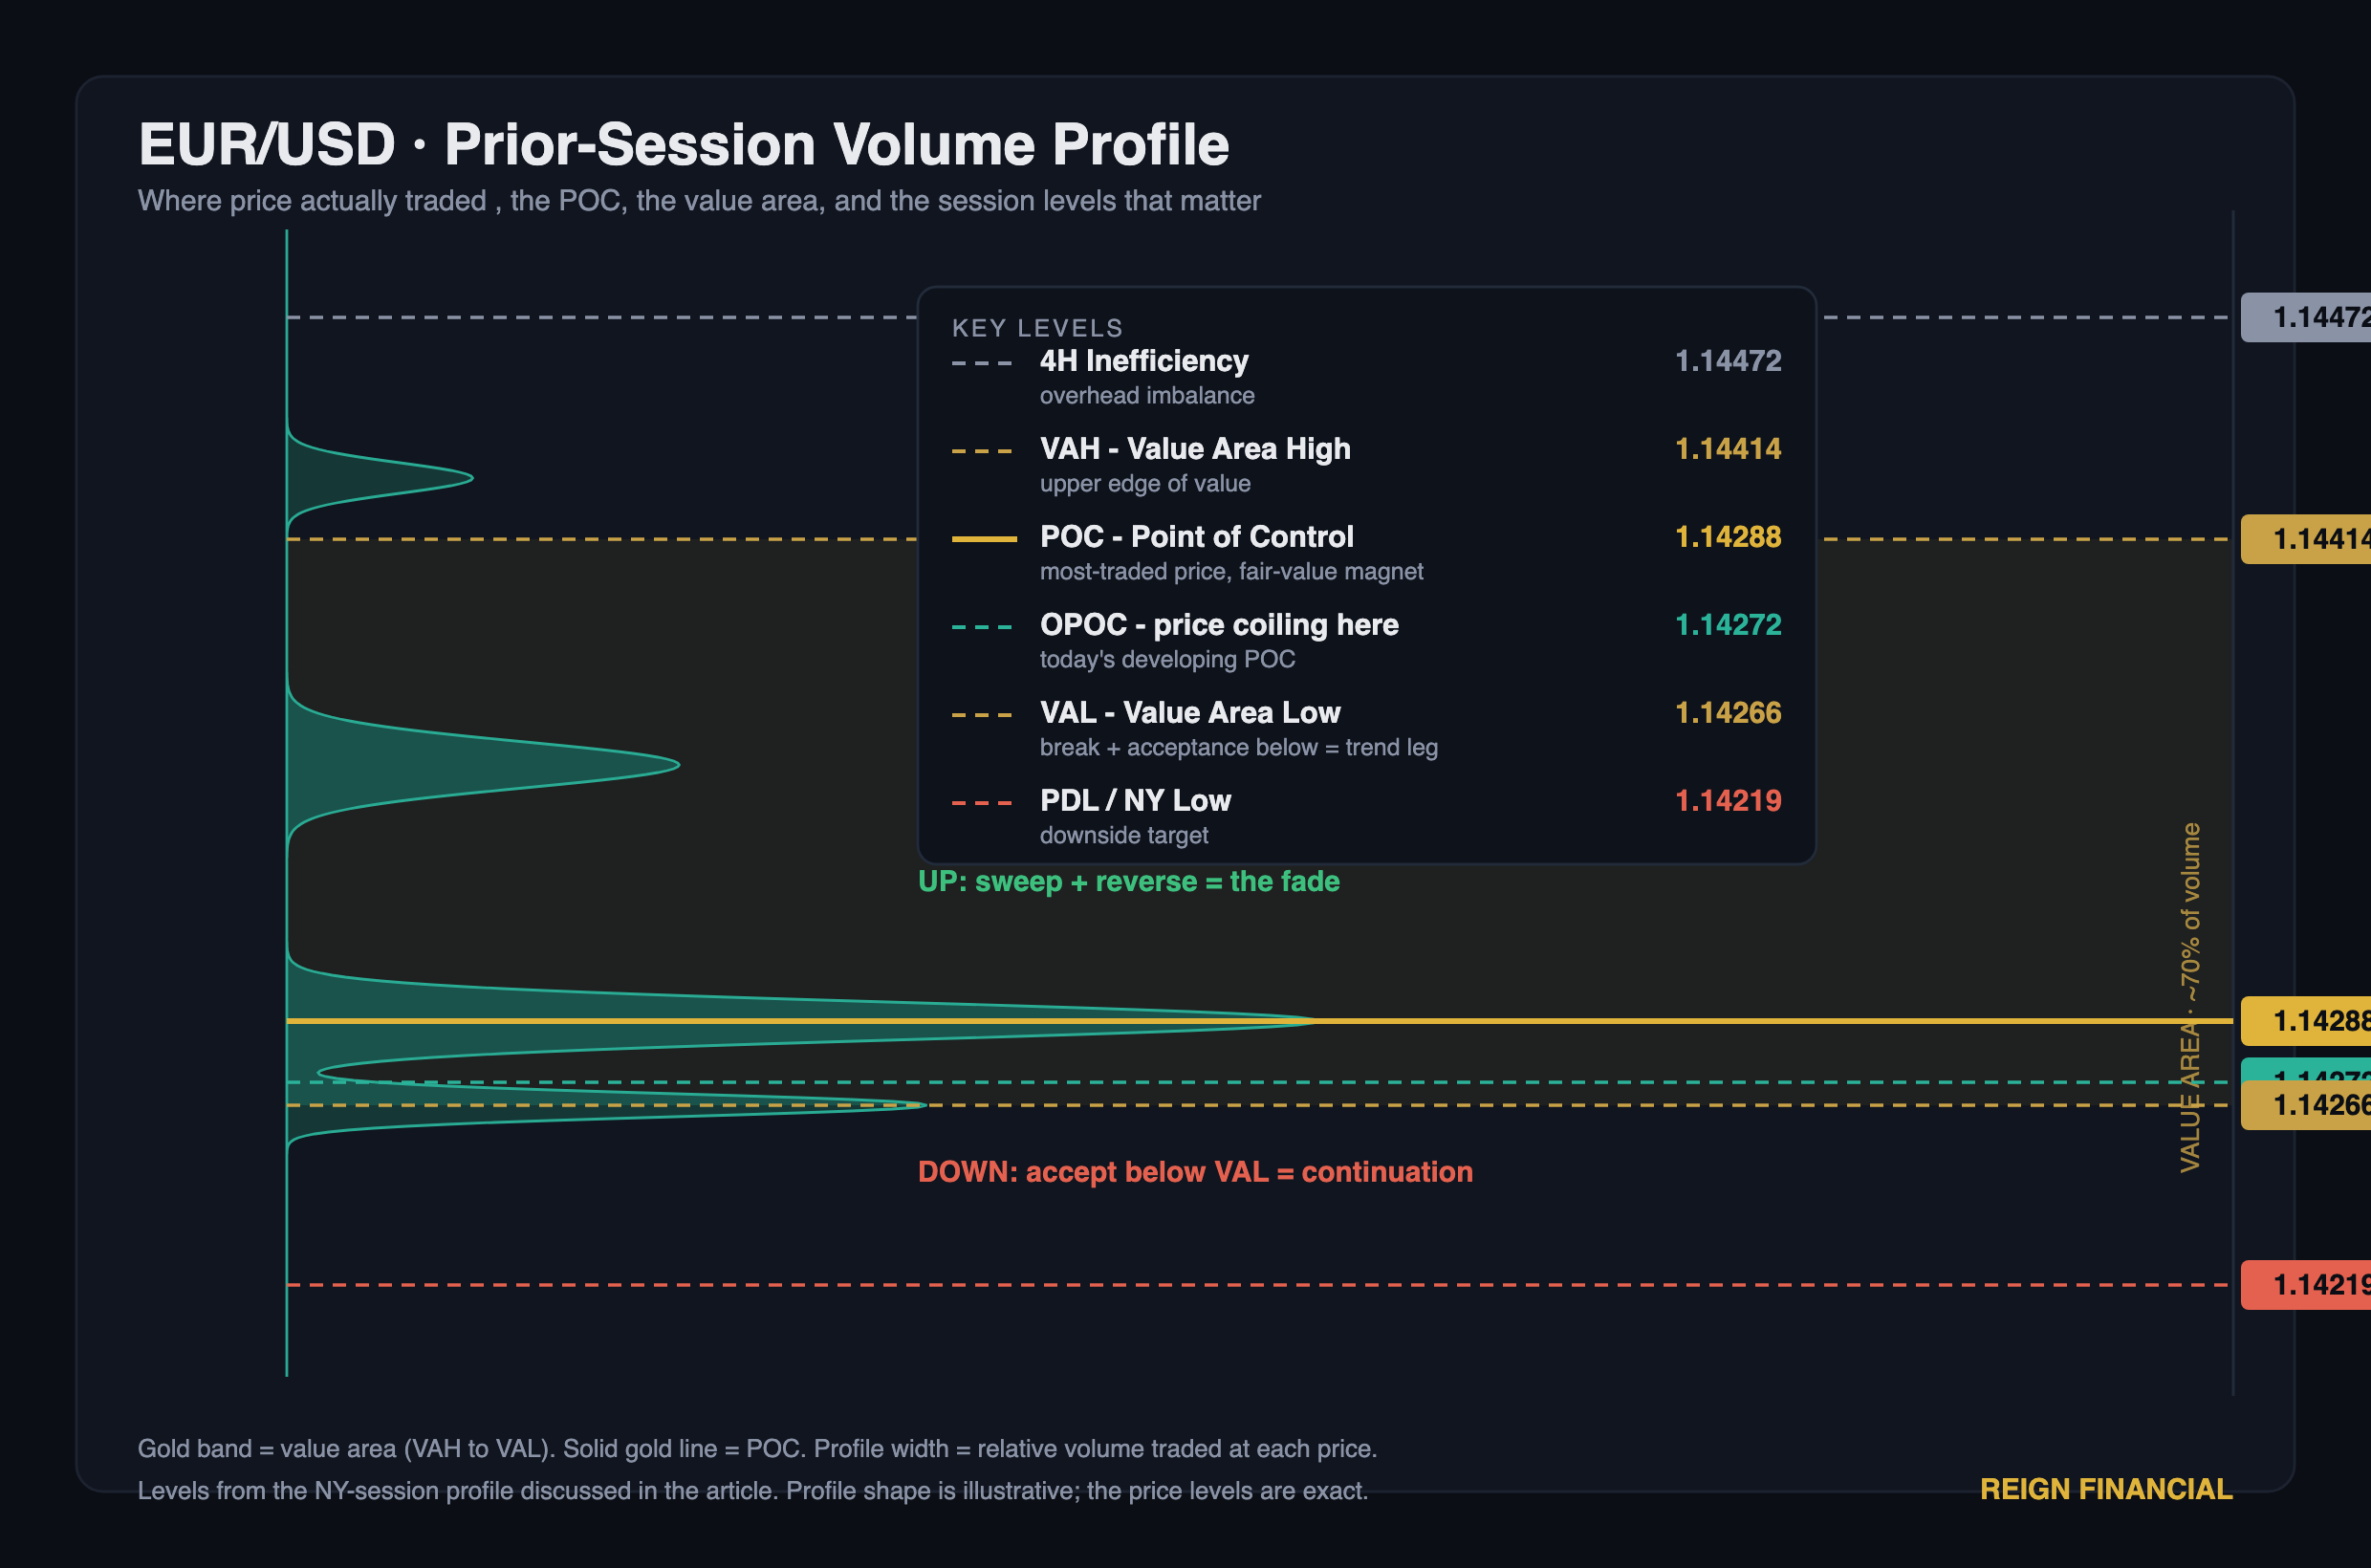
The levels that mattered:
| Level | Price | Why it matters |
|---|---|---|
| 4H inefficiency | 1.14472 | Overhead imbalance, magnet on a sweep up |
| VAH (value area high) | 1.14414 | Upper edge of value |
| POC (point of control) | 1.14288 | Most-traded price, the fair-value magnet |
| OPOC (open / developing POC) | 1.14272 | Where price was coiling |
| VAL (value area low) | 1.14266 | The line that decides the next move |
| PDL / NY low | 1.14219 | Downside target if value breaks lower |
Read it through the strategy, not through a gut call:
- Price opening inside value flagged a trend day, so the expectation was movement, not chop.
- Sitting between the POC (1.14288) and the VAL (1.14266) did not make it bearish by itself. That is the lower half of value, but location does not set direction.
- The first push into the VAL was the decision point. The higher-probability play in this model was the fade: a sweep just under 1.14266 that snaps back up toward the POC and VAH. That is the "UP" path on the chart.
- The bearish continuation only earned its trigger on acceptance below 1.14266, meaning price building new value under the VAL rather than wicking through and reversing. That is the "DOWN" path, and it opened the door to 1.14219.
Same chart, two completely different trades, and the value area alone could not tell you which. The sweep and the acceptance did.
What this means for you
If you want to use this read, hold two things at once.
- "Open inside value, trend day likely" is a useful filter. It tells you to expect movement and to stop fading every wiggle.
- The level is a fade, not a forecast. When price tags the POC, VAL, or VAH on the first move, the higher-probability play in this model is the sweep-and-reverse, not the breakout. The continuation move comes later, on acceptance, not on the first touch.
Volume profile tells you where value is and whether the day is likely to trend. It does not hand you the direction for free. The level tells you to wait for the sweep, and the market you trade tells you how much of the original backtest you actually get to keep.